Oct 13th, 2023
New report on HIV Tests in Ontario 2021
A robust HIV testing program ensures individuals at risk can be tested regularly, linking people who test positive to care and people who test negative to prevention services. Understanding trends in HIV testing can help Ontario measure the success of its HIV testing initiatives.
The Ontario HIV Epidemiology and Surveillance Initiative (OHESI) is pleased to announce a new report: HIV tests in Ontario, 2021. It describes trends in HIV testing in Ontario over the past decade (2012-2021), with a focus on 2021.
Key findings from the 2021 HIV Tests in Ontario Report
In 2021, access to many health services, including HIV testing, continued to be disrupted by the COVID-19 pandemic. OHESI previously discussed the impacts of the pandemic in our blog post and 2020 HIV Testing Report. This blog post and report provides information on HIV tests in Ontario in 2021 as the province began the recovery process while still continuing to be impacted by disrupted access to health services, and changes in migration and sexual behaviour patterns, which in turn, continued to have an impact on HIV testing and diagnoses.
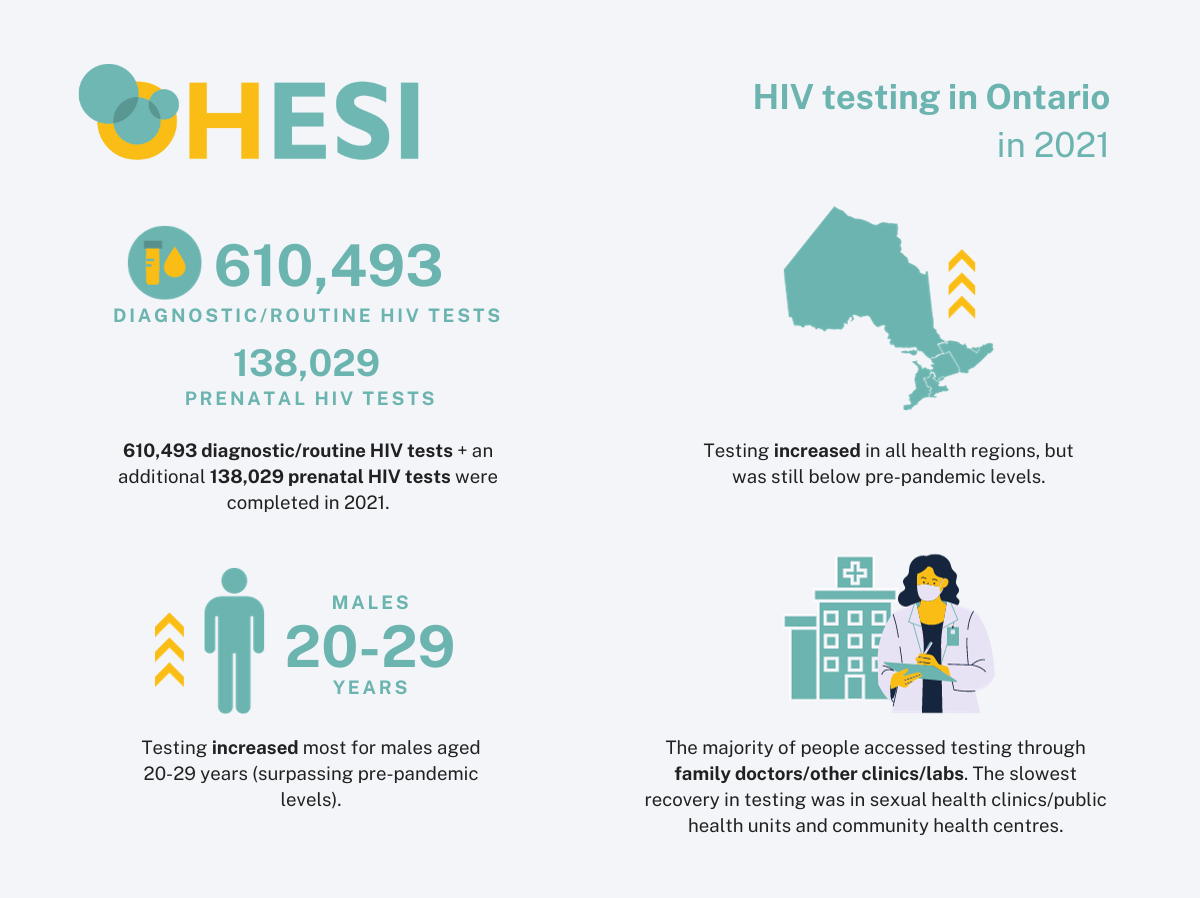
Number of HIV tests began recovering in 2021 but still below pre-pandemic levels
After a sharp 26.1% decrease in the number of HIV [1] tests in 2020 (500,517) compared to 2019 (677,243), the number of HIV tests increased by 22.0% in 2021 (610,493). However, the number of HIV tests in 2021 did not reach its previous pre-pandemic peak, which occurred in 2019. The HIV test positivity (proportion of tests that were first-time HIV diagnoses) reached a new low in 2021 at 0.08% – i.e. for every 10,000 tests, approximately 8 were positive for HIV (a first-time HIV diagnosis). Males made up a slight majority (50.6%, 301,914 tests) of HIV tests in 2021 (prenatal HIV tests excluded) while HIV test postiivty was 0.126% for males and 0.033% for females.
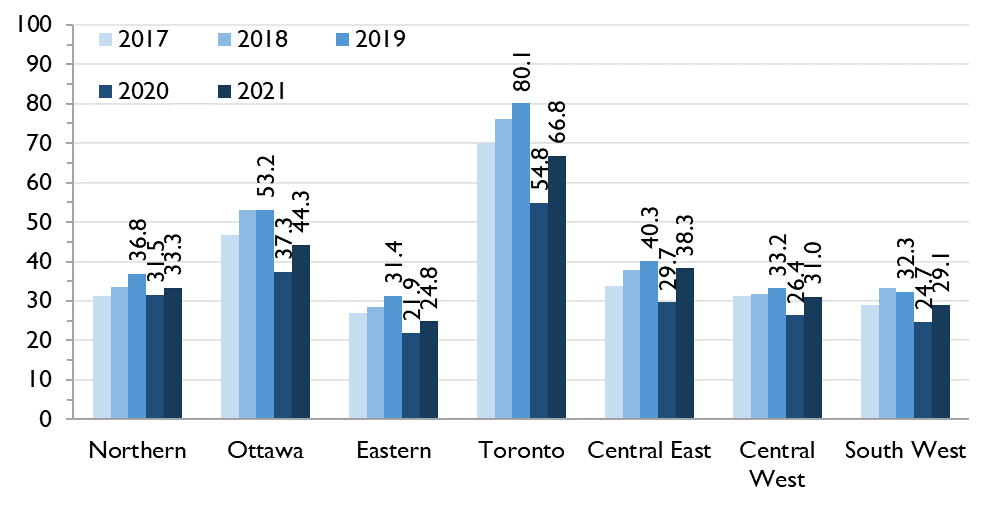
Testing increased in all health regions
Although the number of HIV tests and the HIV test rate per 1,000 people increased in all seven health regions for both males and females between 2020 and 2021, the increase in testing was not distributed evenly across all regions. Compared to 2019, the number of HIV tests in 2021 remained 14% to 19% lower in Eastern, Toronto and Ottawa regions, was less than 5% lower in Central West and Central East and Central East surpassed its 2019 peak of number of tests in 2021 in males. As in prior years, the HIV test rate per 1,000 people was highest in Toronto followed by Ottawa – even though the number of tests has not yet completely recovered – and the Eastern Region continued to have the lowest testing rates.
Figure 1: Rate of HIV tests per 1,000 people, by region, Ontario, 2017 to 2021
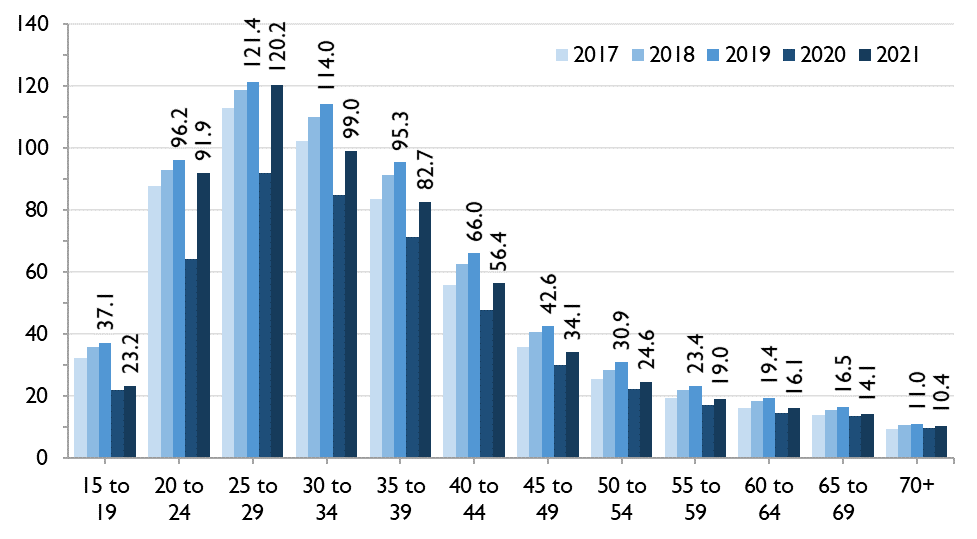
Largest increases in testing were among people in their 20s
The HIV test rate per 1,000 people increased for both males and females across all age groups in 2021 compared to 2020 with one exception: females aged 15 to 19 years. The largest increases in the number of HIV test occurred among people in their 20s. The number of tests in males aged 20 to 24 and 25 to 29 surpassed the 2019 pre-pandemic levels while the number in females aged 25 to 29 almost reached their 2019 pre-pandemic levels indicating that this age group had the greatest recovery in HIV testing.
Figure 2: Rate of HIV tests per 1,000 people, by age, Ontario, 2017 to 2021
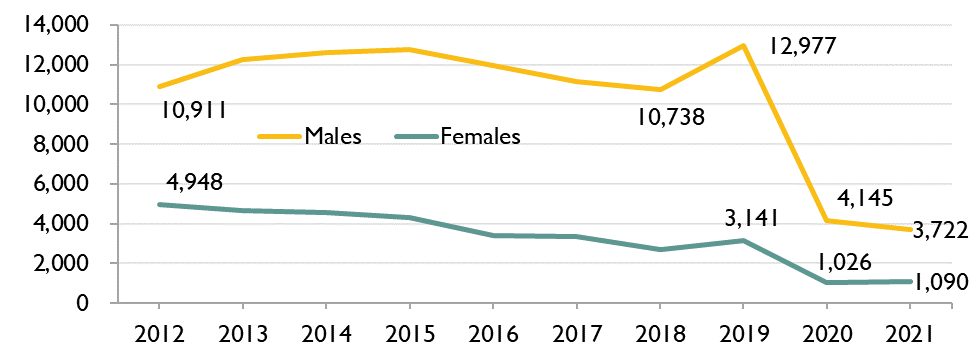
Drop in anonymous testing continued
Over the last decade, the vast majority (more than 90%) of HIV tests have been conducted through standard testing programs using patient name (nominal testing) and this has been increasing over time. Between 2012 and 2019, the number of tests conducted anonymously was fairly stable; however, in 2020 (the first year of the COVID-19 pandemic), the number of anonymous tests dropped by 68% and, in 2021, it fell another 6.6%. As a result, anonymous testing accounted for only 0.8% of HIV testing in 2021. The decrease was mainly due to the fact that most anonymous testing sites are operated by public health sexual health clinics – many of which were closed during the COVID-19 pandemic.
Figure 3: Number of anonymous HIV tests, by sex, Ontario, 2012 to 2021
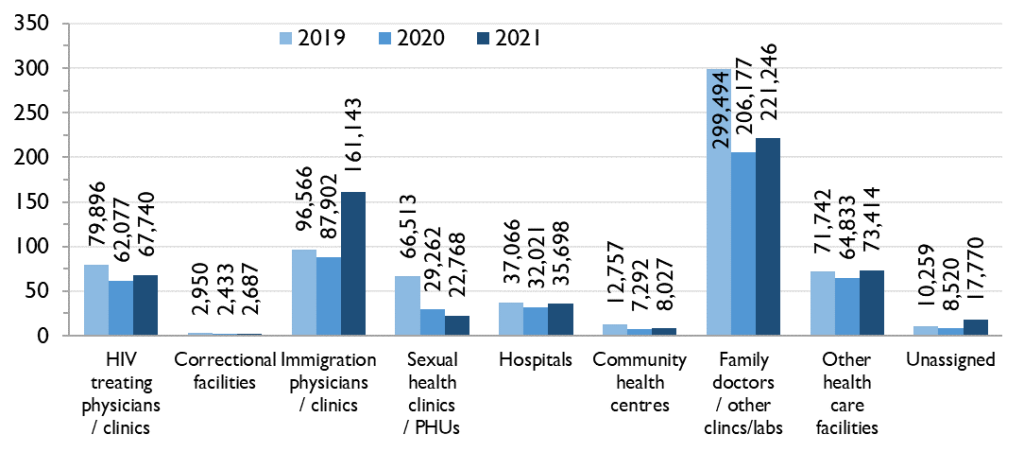
Sexual health clinics/public health units and community health centres continued to be impacted by COVID-19
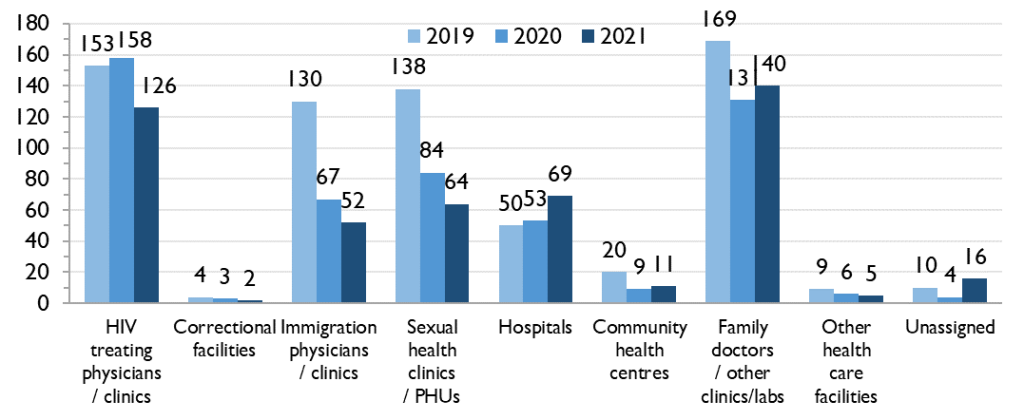
In 2021, HIV tests submitted by ‘‘family doctors/other clinics/labs’ made up the largest number of HIV tests (221,246), followed by immigration physicians/clinics (161,143), other health care facilities (73,414) and HIV treating physicians/clinics (67,740). Compared to 2020, the number of HIV tests increased for all submitter types in 2021 (except for sexual health clinics/PHUs), with the greatest relative increases seen in immigration physicians/clinics (83.3%), and other health care facilities (13.2%). This suggests some facilities that provided HIV tests continued to be impacted by closures and/or staffing shortages due to COVID-19 while changes in immigration policies affecting the number of migrations and therefore HIV tests coming from the immigration process also affected testing numbers.
Figure 4a: Number of HIV tests (thousands), by HIV test submitter type, Ontario, 2019 to 2021
In 2021, tests submitted by ‘family doctors/other clinics/labs’ contributed the largest number of first-time HIV diagnoses [2]. The number of tests that were first-time HIV diagnoses that were submitted by HIV treating physicians/clinics and immigration physicians/clinics each decreased in 2021 compared to 2019 and 2020. The numbers of tests that were first-time HIV diagnoses submitted by hospitals and family doctors/other clinics/labs, each increased in 2021 compared to 2020 overall with the largest increase among males at hospitals.
Figure 4b: Number of first-time HIV diagnoses by HIV test submitter type, Ontario, 2019 to 2021
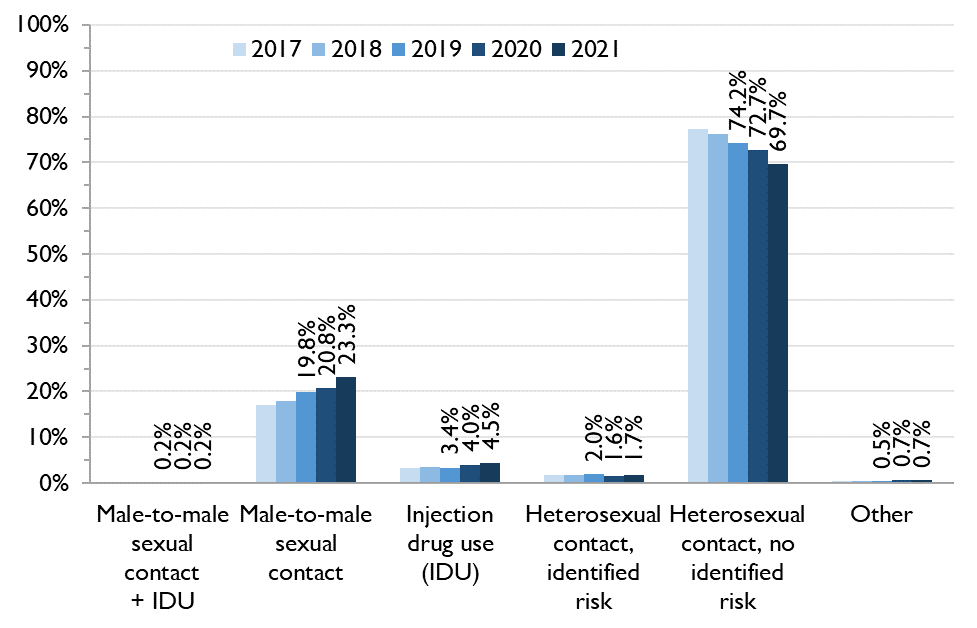
Distribution of tests by HIV exposure category remained consistent
In 2021, only about 20% of HIV test requisitions had information on risk factor or exposure category completed. However, among that 20%, the distribution of HIV tests by HIV exposure category remained largely consistent with the previous four years. This indicates that although overall testing numbers remain down, it is unlikely that a single group experienced a disproportionate decrease in testing. Where HIV exposure category was reported, the most frequently reported exposure category was males and then females reporting heterosexual contact with no identified risk [3] followed by males reporting male-to-male sexual contact, and males and females reporting injection drug use (IDU).
Figure 5: Percent of HIV tests by exposure category (where reported), Ontario, 2017 to 2021
For more information, see the full report here.
Stay tuned for more OHESI reports coming soon!
References
1. HIV tests and first-time HIV diagnoses do not include HIV tests or HIV diagnoses with previous evidence of HIV; that is, it excludes people who already knew their HIV status at the time of their first positive nominal diagnostic test in Ontario. HIV tests also exclude negative tests done as part of the HIV prenatal testing program.
2. First-time HIV diagnoses do not include HIV diagnoses with previous evidence of HIV; that is, it excludes people who already knew their HIV status at the time of their first positive nominal diagnostic test in Ontario. First-time HIV diagnoses stratified by submitter type uses information collected from the ordering physician on the HIV test requisition form and does not include information collected from the Laboratory Enhancement Form (LEP).
3. “Identified risk” means either the individual’s country of birth is reported as an HIV-endemic country, or the individual’s opposite-sex/gender partner is reported to be at least one of: HIV-positive; user of injection drugs; born in an HIV-endemic country; a bisexual male.