Nov 17th, 2023
Key Findings from the report “HIV in Ontario by public health unit: tests & diagnoses 2021, and care cascade 2020”
New report on HIV tests and first-time HIV diagnoses (2021) and the HIV Care Cascade in Ontario (2020)
The Ontario HIV Epidemiology and Surveillance Initiative (OHESI) is pleased to announce a new report: HIV in Ontario by public health unit: tests & diagnoses 2021, and care cascade 2020. Broken down by public health units (PHUs), it describes trends in HIV tests and first-time HIV diagnoses in Ontario from 2017 to 2021, and the metrics of the HIV Care Cascade in 2020. Key findings are highlighted in this blog post. Understanding trends in HIV tests, diagnoses, and the care cascade can help Ontario measure the success of its initiatives.
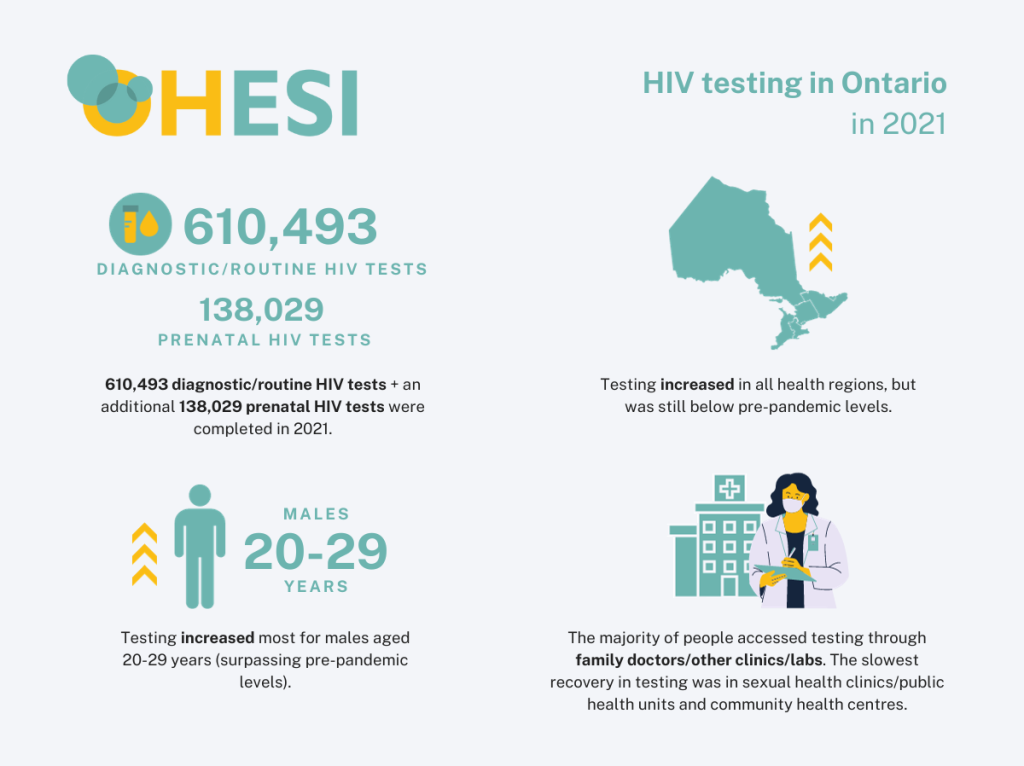
The COVID-19 pandemic affected access to HIV testing and clinical care, starting in 2020 and continuing into 2021. OHESI previously discussed its impact in our blog post, Impact of COVID-19 Pandemic on HIV testing and diagnosis in Ontario.
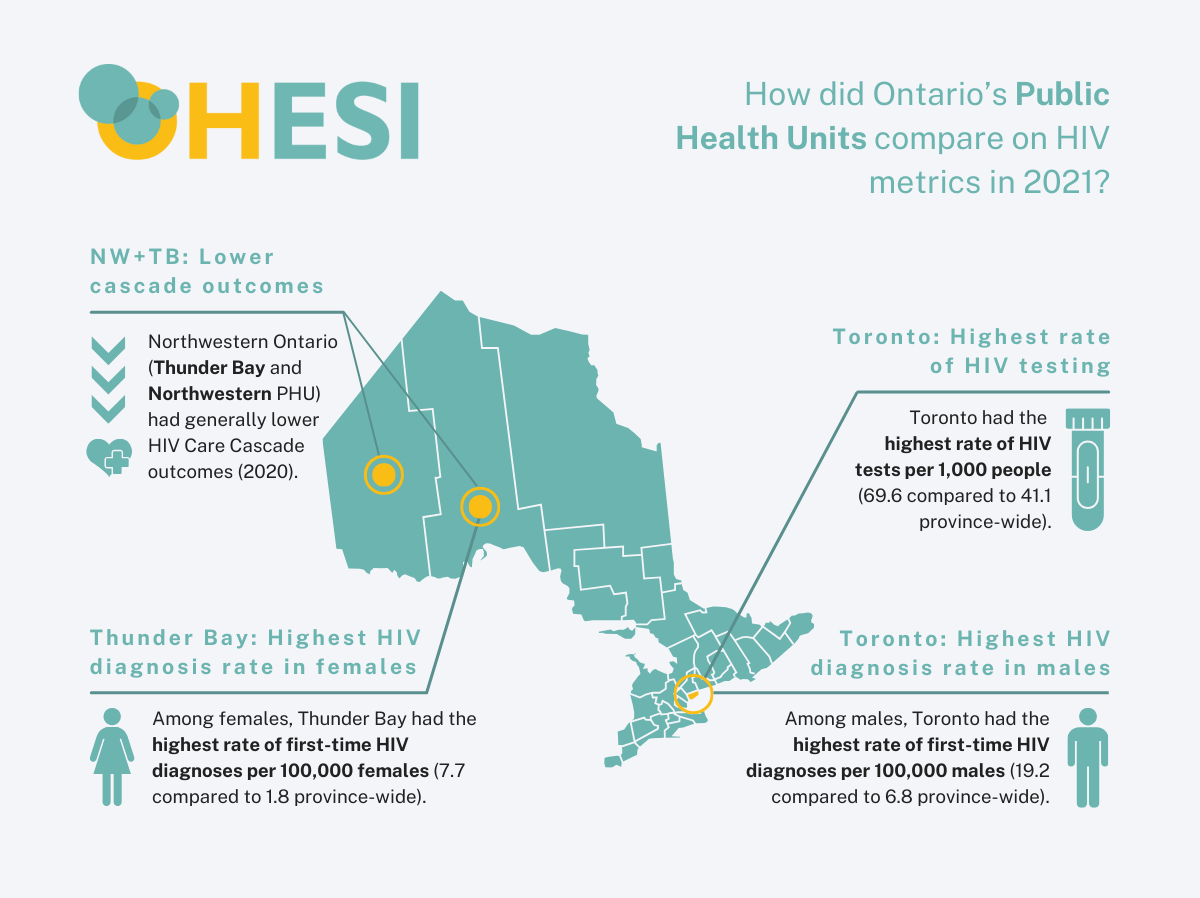
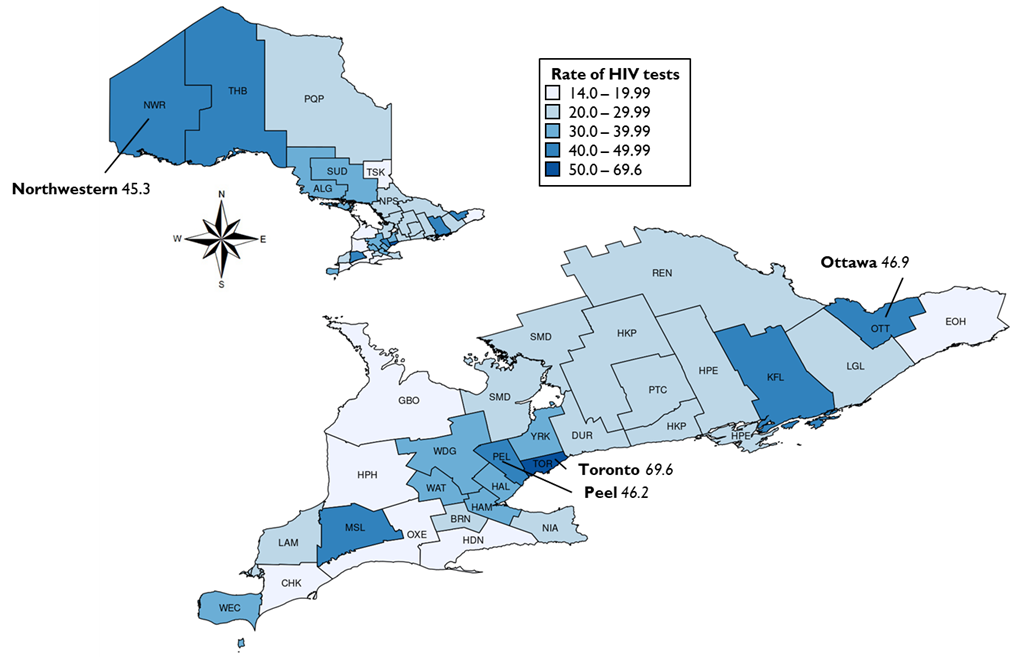
More HIV tests per capita in the largest cities and Northwestern Ontario
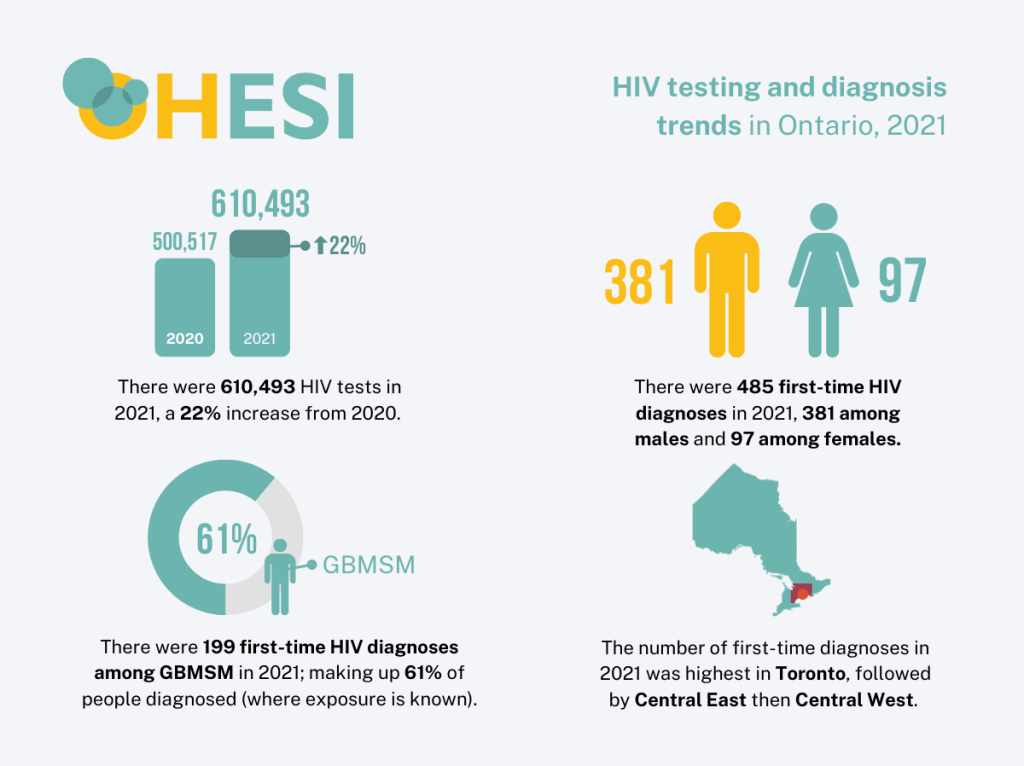
Overall, the average HIV test rate in Ontario between 2017 and 2021 was 41.1 per 1,000 people. Test rates were highest in Toronto (69.6), Ottawa (46.9), Peel (46.2), and Northwestern (45.3; Figure 1 below).
Figure 1: Average rate of HIV tests per 1,000 people by public health unit, Ontario, 2017 to 2021
Rates of first-time HIV diagnoses per capita were highest in Toronto among males and highest in Northwestern Ontario among females
Overall, the average rate of first-time HIV diagnoses per 100,000 people in Ontario between 2017 and 2021 was 6.8 among males and 1.8 among females. Rates were highest in Toronto (19.2), Middlesex-London (7.7), and Windsor-Essex (7.5) among males (Figure 2 below), and highest in Thunder Bay (7.7), Northwestern (4.5) and Toronto (3.7) among females (Figure 3 below).
Note: A previous OHESI analysis estimated that, due to missing data on HIV test history, between 6.9% and 8.1% of first-time HIV diagnoses between 2011 and 2020 (between 5.0% and 5.9% among males and between 15.0% and 17.4% among females) had an uncaptured previous HIV diagnosis. More information about categorization of positive HIV tests as first-time HIV diagnoses can be found here.
Figure 2: Average rate of first-time HIV diagnoses per 100,000 people by public health unit, males, Ontario, 2017 to 2021
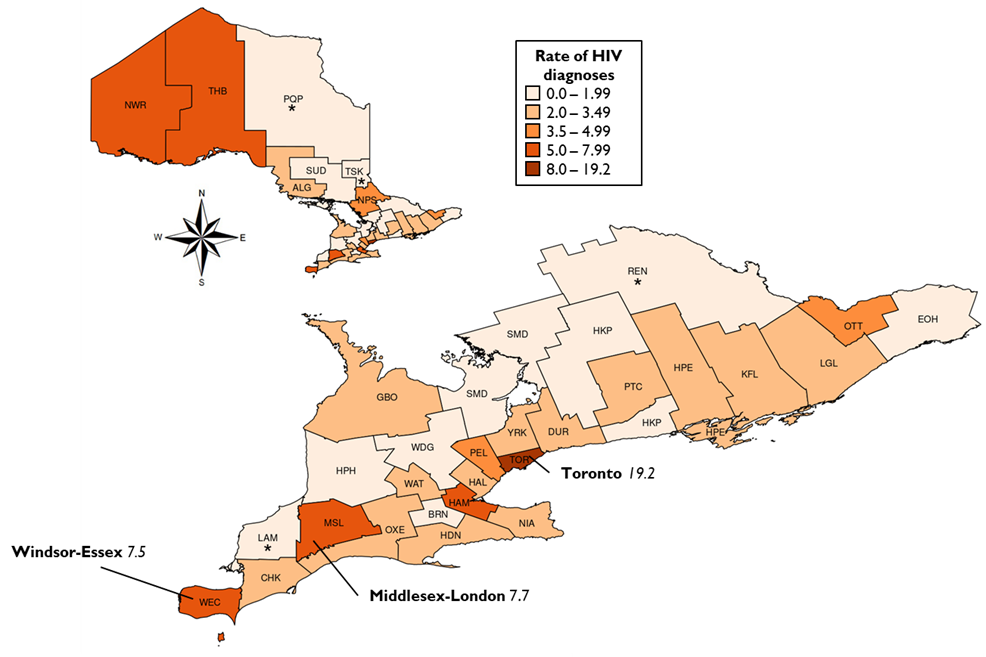
*Indicates the diagnosis rate is based on fewer than 5 diagnoses and should therefore be interpreted with caution.
Figure 3: Average rate of first-time HIV diagnoses per 100,000 people by public health unit, females, Ontario, 2017 to 2021
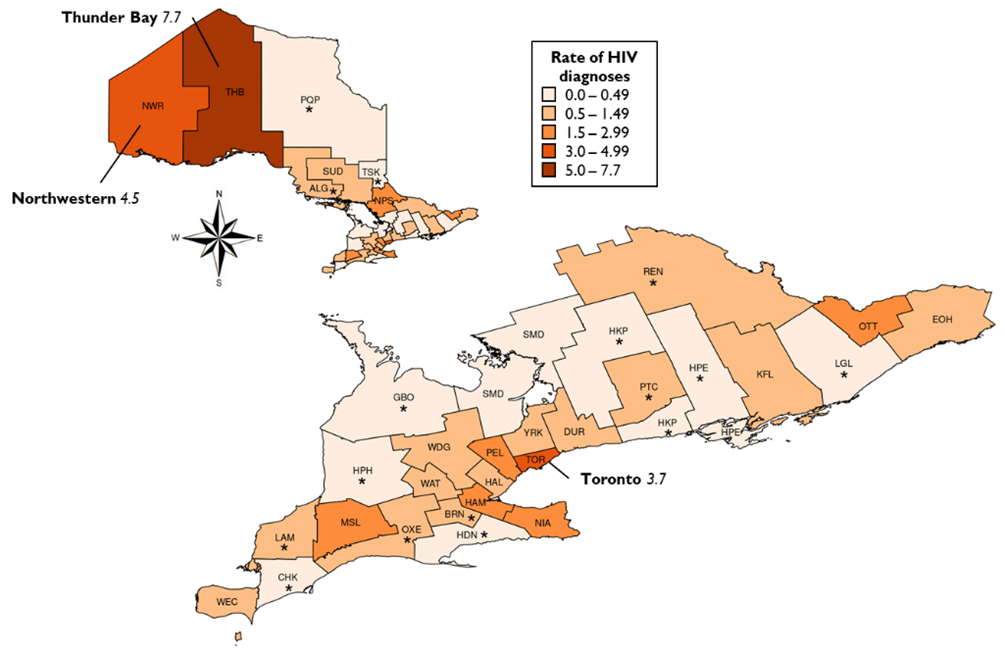
*Indicates the diagnosis rate is based on fewer than 5 diagnoses and should therefore be interpreted with caution.
Toronto had the highest HIV test positivity among males and Northwestern Ontario, especially Thunder Bay, had the highest HIV test positivity among females
Overall, the average HIV test positivity in Ontario between 2017 and 2021 was 0.17% among males and 0.04% among females. The average HIV test positivity was highest in Toronto (0.26%), Windsor-Essex (0.25%), and Southwestern (0.19%) among males (Figure 4 below), and highest in Thunder Bay (0.17%), Northwestern (0.09%), Hamilton (0.07%), and North Bay-Parry Sound (0.07%) among females (Figure 5 below).
Figure 4: Average HIV test positivity by public health unit, males, Ontario, 2017 to 2021
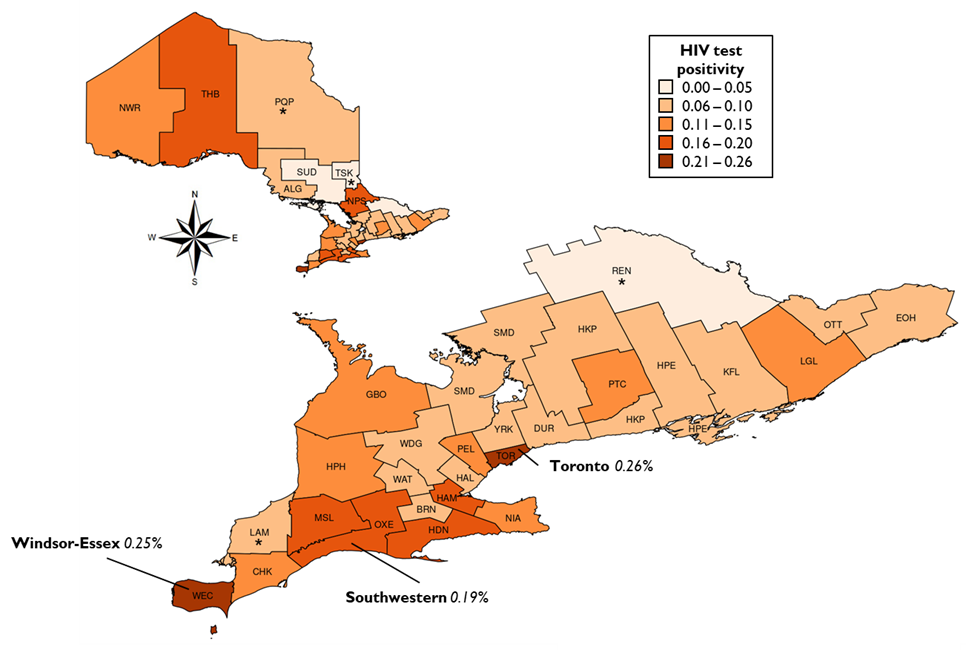
*Indicates the test positivity is based on fewer than 5 diagnoses and should therefore be interpreted with caution.
Figure 5: Average HIV test positivity by public health unit, females, Ontario, 2017 to 2021
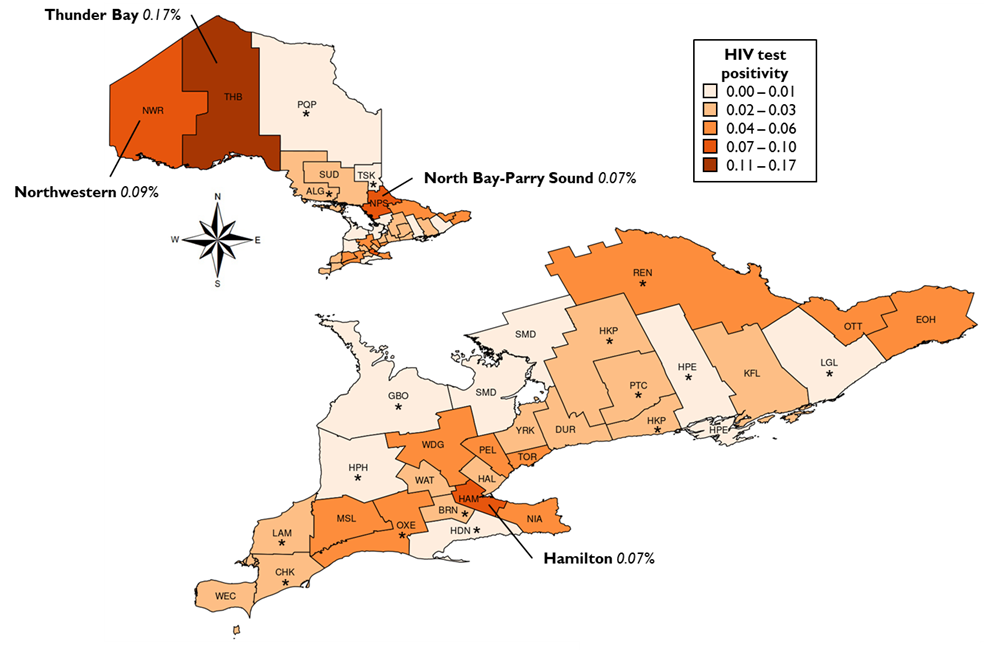
*Indicates the test positivity is based on fewer than 5 diagnoses and should therefore be interpreted with caution.
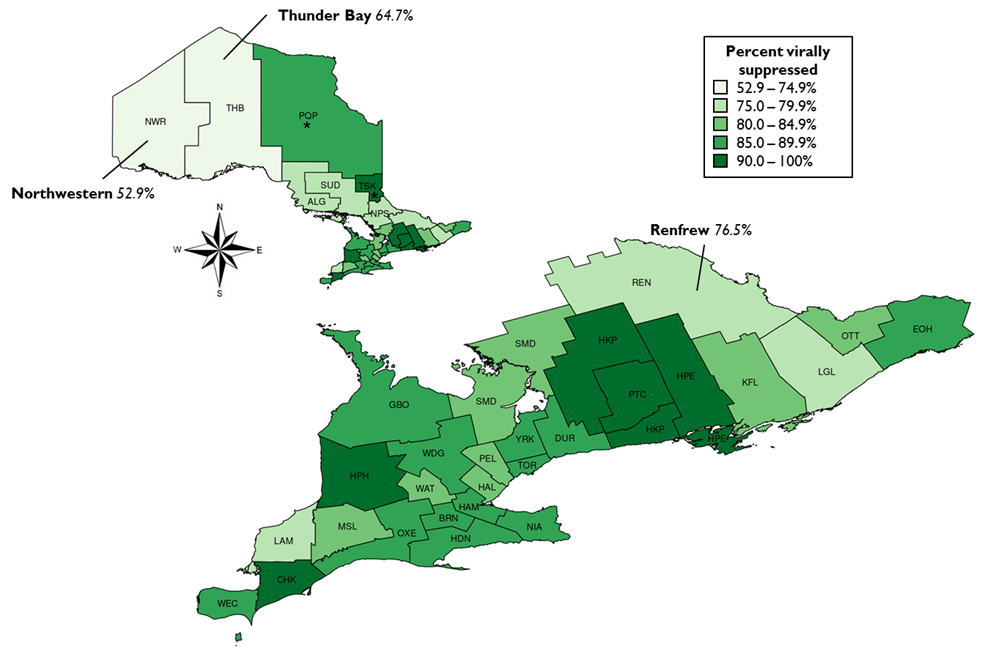
Northwestern Ontario had generally lower HIV care cascade outcomes
Ontario-wide, 89.2% of people living with diagnosed HIV in 2020 were in care, 86.8% were on antiretroviral treatment (ART), and 84.8% were virally suppressed (<200 copies/mL on last viral load test). PHUs in Northwestern Ontario had generally lower HIV care cascade outcomes: in Northwestern PHU, 67.6% were in care, 64.7% on ART, and 52.9% were virally suppressed (Figure 6 below); in Thunder Bay these proportions were 82.0%, 67.6%, and 64.7%, respectively. Renfrew also had lower outcomes: 78.4%, 76.5%, and 76.5%, respectively.
It is important to note that these proportions consistently use the number of people diagnosed with HIV as the denominator and therefore are not the UNAIDS 90-90-90 target metrics.
People living with HIV in the Northwestern PHU may receive HIV care in Manitoba and therefore appear as not in care in the Public Health Ontario Laboratory Cohort, decreasing the cascade outcomes for this PHU in this report.
Figure 6: Percent of people with diagnosed HIV living in Ontario who were virally suppressed by public health unit, 2020
For more information, see the full report here.
Codes for Public Health Units (PHUs) used in this blog post.
| Code | Name | Code | Name | Code | Name | ||||||
|---|---|---|---|---|---|---|---|---|---|---|---|
| ALG | Algoma District | KFL | Kingston-Frontenac and Lennox and Addington | PTC | Peterborough County-City | ||||||
| BRN | Brant County | LAM | Lambton | REN | Renfrew County and District | ||||||
| CHK | Chatham-Kent | LGL | Leeds-Grenville and Lanark District | SMD | Simcoe Muskoka District | ||||||
| DUR | Durham Regional | MSL | Middlesex-London | SUD | Sudbury and District | ||||||
| EOH | Eastern Ontario | NIA | Niagara Regional Area | THB | Thunder Bay District | ||||||
| GBO | Grey Bruce | NPS | North Bay Parry Sound District | TOR | City of Toronto | ||||||
| HAL | Halton Regional | NWR | Northwestern | TSK | Timiskaming | ||||||
| HAM | City of Hamilton | OTT | City of Ottawa | WAT | Waterloo | ||||||
| HDN | Haldimand-Norfolk | OXE | Southwestern | WDG | Wellington-Dufferin-Guelph | ||||||
| HKP | Haliburton-Kawartha-Pine Ridge District | PEL | Peel Regional | WEC | Windsor-Essex County | ||||||
| HPE | Hastings-Prince Edward Counties | PQP | Porcupine | YRK | York Regional | ||||||
| HPH | Huron Perth |
Stay tuned for more OHESI reports coming soon!
OHESI is a collaboration involving HIV and Hepatitis C Programs of the Ontario Ministry of Health, Public Health Ontario, the Public Health Agency of Canada, and the Ontario HIV Treatment Network. The objectives of OHESI are to analyze, monitor and disseminate knowledge products on the epidemiology of HIV in Ontario.