Oct 21st, 2020
OHESI releases new report on HIV Testing in Ontario 2018
The Ontario HIV Epidemiology and Surveillance Initiative (OHESI) is pleased to announce the release of a new report titled “HIV Testing in Ontario, 2018”.
Analyzing HIV testing data in Ontario is critical to measuring our success in the HIV prevention, engagement and care cascade. A robust testing program ensures that individuals at risk receive regular HIV tests and that people who are living with HIV can learn their status and be linked to care. HIV testing is also an important gateway to prevention services for people who test HIV-negative. Trends in HIV testing can also help Ontario measure the success of its HIV testing initiatives.
In the 2018 HIV Testing Report, OHESI describes the trends in HIV testing in Ontario over the past decade (2009-2018), with a focus on HIV test in 2018. The report includes analyses broken down by type of test (nominal, coded, and anonymous), sex, age, HIV exposure category, and geographic location (health regions), as well as information specific to rapid/point-of-care (POC) and prenatal HIV testing. Metrics described in the report include the number and percent of HIV tests, rates of HIV tests per 1,000 people, and HIV test positivity rates (i.e. the percent of HIV diagnostic tests with a confirmed HIV-positive result), among other analyses.
Some of the key findings of the report:
- In 2018, there were 637,780 HIV tests in Ontario – equivalent to an HIV testing rate of 44.5 tests per 1,000 people.
- While the number of tests conducted remained relatively stable between 2009 and 2013, it increased 44.4% between 2013 and 2018. The HIV testing rate per 1,000 people also increased 36.2% during this time.
- From 2013 to 2018, the number of HIV tests among males and females was very similar (309,163 vs. 308,844, respectively). However, in 2017, the number of HIV tests among males was greater than the number among females.
- While the HIV test positivity rate decreased over time for both sexes, it was consistently three to four times higher among males than females. In 2018, the positivity rate was 0.19% for males and 0.05% for females.
- Between 2014 and 2018, the HIV testing rate per 1,000 people increased for all age groups by an average of 37% and was consistently highest among people ages 25 to 29.
- The HIV test positivity rate in 2018 was highest in the 55-59 age category for both males (0.24%) and females (0.15%).
- In 2018, the vast majority of HIV tests (96.6%) – including POC tests – were nominal and the remainder were coded (1.3%) or anonymous (2.2%).
- While the HIV test positivity rate has decreased over time for all test types, it was consistently at least four times higher among people who tested anonymously compared to those who tested nominally. In 2018, the test positivity rate was 0.10% for nominal testing, 0.12% for coded testing and 0.71% for anonymous testing.
- Between 2014 and 2018, the percent of HIV tests in males attributed to men who have sex with men (MSM) increased from 26.0% to 32.3%.
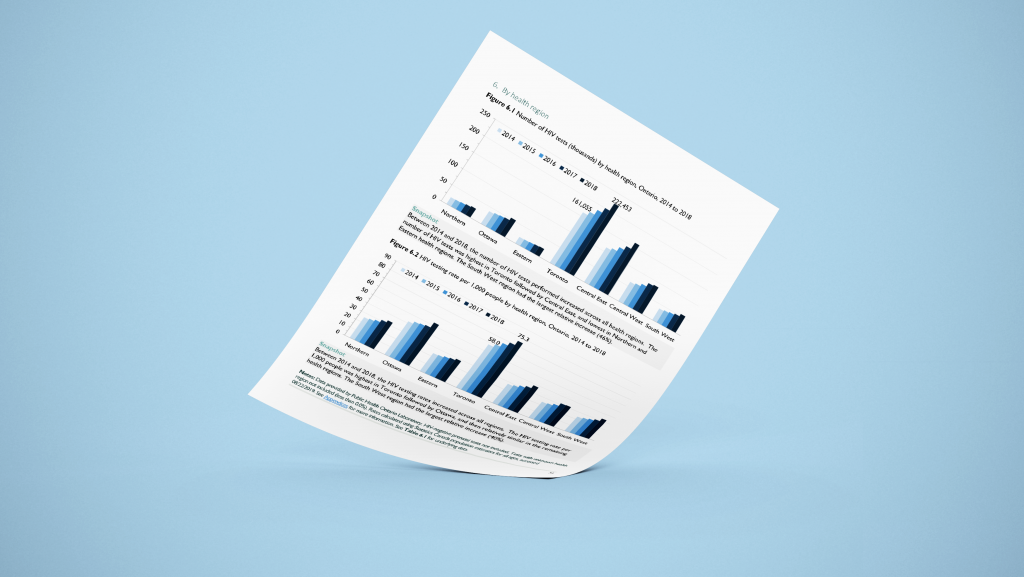
- In 2018, the HIV testing rate per 1,000 people was highest in Toronto (75.3) followed by Ottawa (53.0). The number of HIV tests and the HIV testing rate increased between 2017 and 2018 in all health regions.
- Between 2014 and 2018, the number of point-of-care (POC) tests decreased by 39.8% from 30,117 to 18,142 through more targeted testing to priority populations, while the positivity rate from POC testing increased from 0.42% to 0.69%.
- Between 2012 and 2017, the estimated percent of all pregnant people who received a prenatal HIV test increased from 94.2% to 96.2% (estimate for 2018 not available).
Stay tuned for future reports from OHESI!