Oct 4th, 2022
Key findings from the 2020 HIV Care Cascade Report
New report on HIV Care Cascade in Ontario 2020
The Ontario HIV Epidemiology and Surveillance Initiative (OHESI) is pleased to announce a new report: HIV care cascade in Ontario: Linkage to care, in care, on antiretroviral treatment, and virally suppressed, 2020. It describes trends in the metrics of the HIV care cascade in Ontario over two decades (2000-2020), with a focus on 2020. Key findings are highlighted in this blog post.
The COVID-19 pandemic affected access to HIV testing and clinical care in 2020. OHESI previously discussed its impact in our blog post, Impact of COVID-19 Pandemic on HIV testing and diagnosis in Ontario. Previous blog posts have described the 2020 HIV care cascade specifically among Women and gay, bisexual, and other men who have sex with men (GBMSM). This report describes the overall 2020 HIV care cascade, as well as breakdowns by sex*, age, and health region. Understanding trends in the HIV care cascade can help Ontario measure the success of its initiatives.
*Sex is limited to male and female due to limitations of historic data capture.
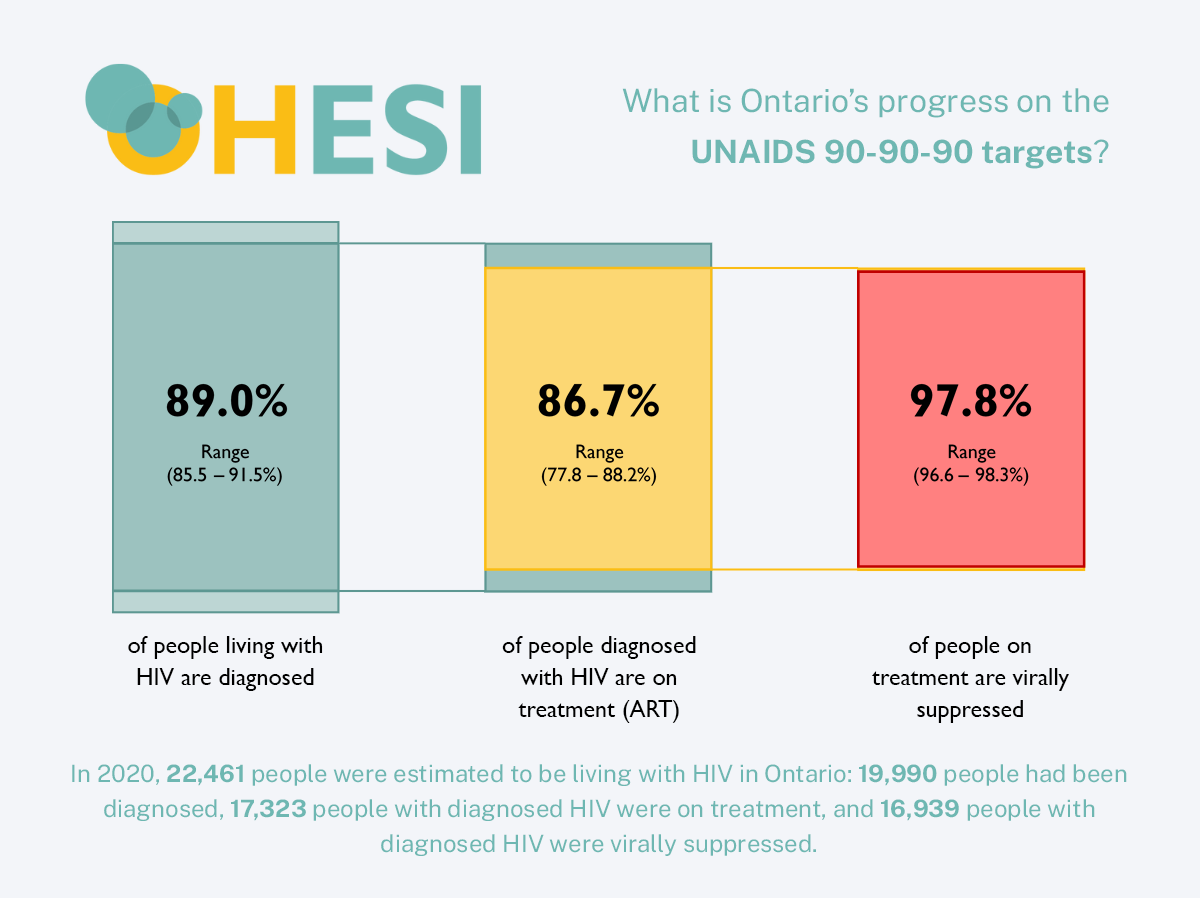
Ontario met 1 of 3 UNAIDS targets by 2020 and fell just shy of the other 2
In 2014, UNAIDS made supporting people with HIV through the stages of the care cascade a global priority. To measure progress towards this goal, UNAIDS recommended the 90-90-90 targets: by 2020, 90% of all people living with HIV would be diagnosed, 90% of all people diagnosed with HIV infection would be on antiretroviral therapy (ART), and 90% of all people receiving ART would be virally suppressed.
Figure 1: UNAIDS 90-90-90 Estimates, Ontario, 2020
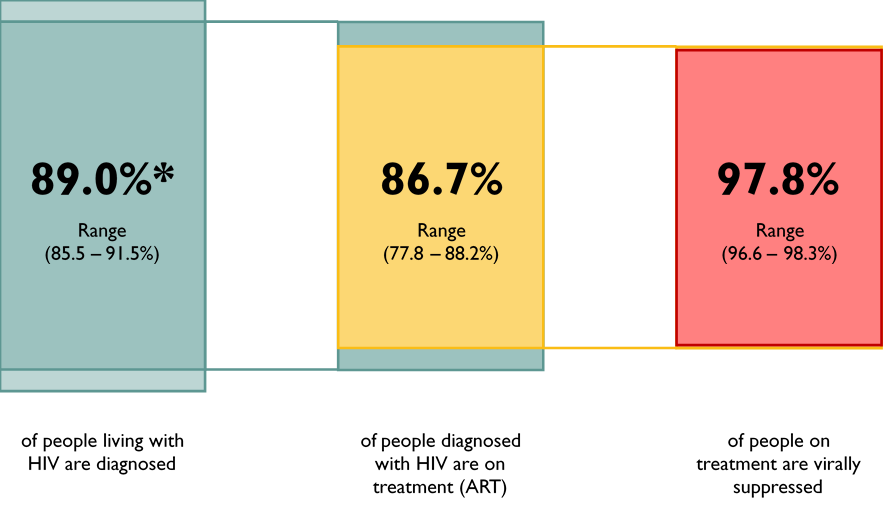
In Ontario in 2020, the first 90, or the percentage of people living with HIV who were diagnosed was 89.0%, meaning that an estimated 11.0% of people in Ontario living with HIV were undiagnosed. The undiagnosed fraction is produced based on modelling of the prevalence of HIV, and of the estimated number of people who have been diagnosed with HIV and are living in Ontario done by the Public Health Agency of Canada. The second 90, the percentage of people diagnosed who were on treatment, was 86.7%. The third 90, the percentage of people on treatment who were virally suppressed, was 97.8%.
*The proportion of people living with HIV that were diagnosed was provided by the Public Health Agency of Canada (PHAC), with inputs from the Public Health Ontario (PHO) Laboratory.
By 2020, almost 20,000 Ontarians were living with diagnosed HIV
Figure 2: Number of people with diagnosed HIV living in Ontario, 2000 to 2020
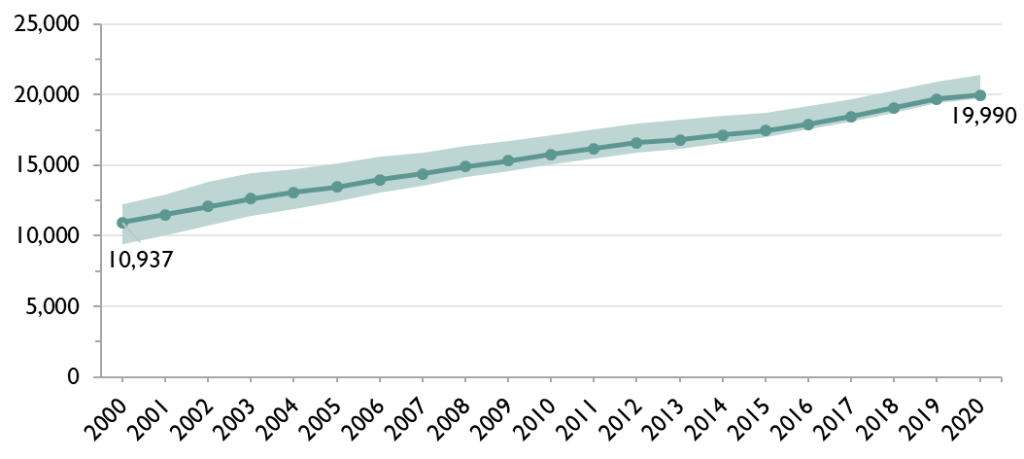
The number of people with diagnosed HIV living in Ontario increased from 10,937 in 2000 (range 9,420 to 12,233) to 19,990 (range 19,723 to 21,393) in 2020. The increase is due to a combination of longer life expectancy for people on treatment (fewer deaths) and people living with HIV being newly diagnosed (ongoing transmission observed through HIV testing) or moving to Ontario.
Larger proportions of people living with diagnosed HIV were in HIV care, on ART, and virally suppressed over time
Figure 3. Percent of people with diagnosed HIV living in Ontario who were in care, 2000 to 2020
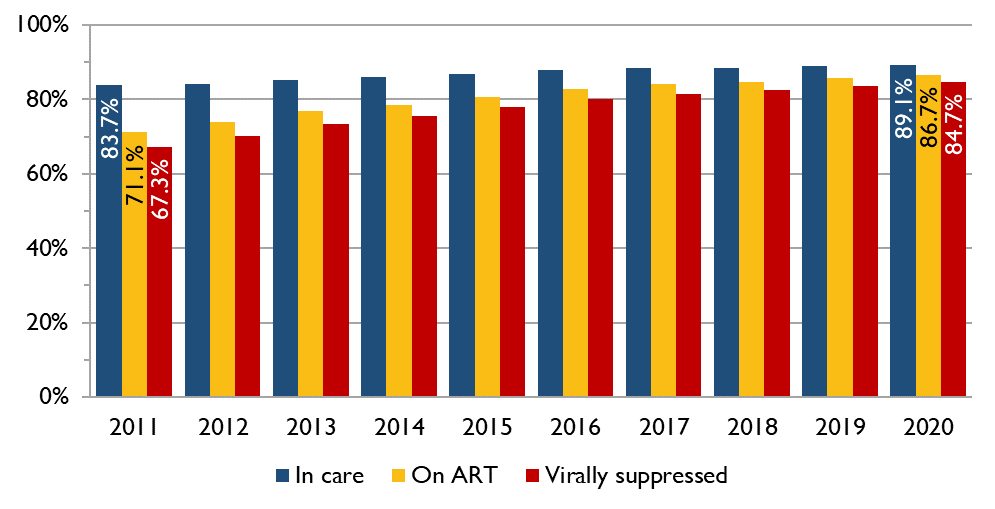
Between 2011 and 2020, among people living with diagnosed HIV, the percent in HIV care increased from 83.7% to 89.1%, the percent on ART increased from 71.1% to 86.7%, and the percent virally suppressed increased from 67.3% to 84.7%.
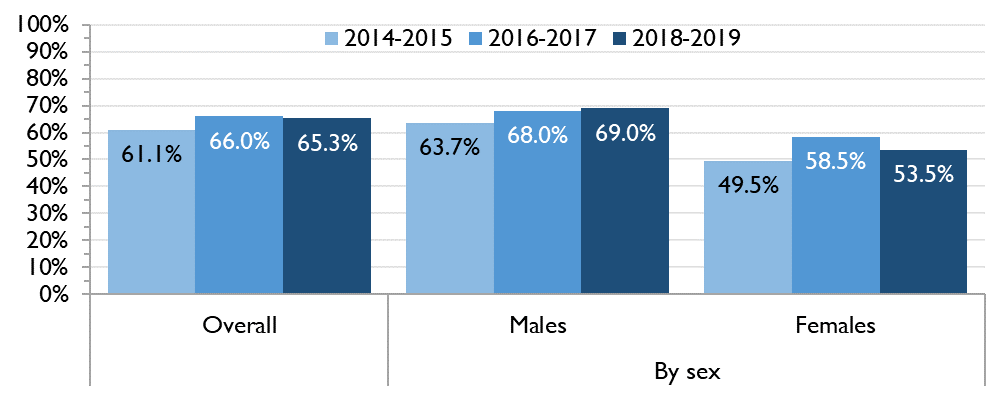
Amongst those newly diagnosed with HIV, a higher proportion of males are linked to HIV care within one month of diagnosis compared to females
Figure 4. Percent of people newly diagnosed with HIV in Ontario (nominally) linked to care within one month of diagnosis, overall and by sex, 2014-2015 to 2018-2019
*VL = viral load
The proportion of all people newly diagnosed with HIV who were linked to care within one month of diagnosis increased from 61.1% in 2014-2015 to 65.3% in 2018-2019. Among males, the proportion increased from 63.7% in 2014-2015 to 69.0% in 2018-2019. Among females, 49.5% were linked to care within one month in 2014-2015, 58.5% in 2016-2017, and 53.5% in 2018-2019. The difference between males and females narrows when looking at the proportions linked to care within three months of diagnosis (85.8% vs. 82.6%, respectively).
9.0% of males and 10.3% of females did not link to care at all in 2018-2019 (included in the denominator).
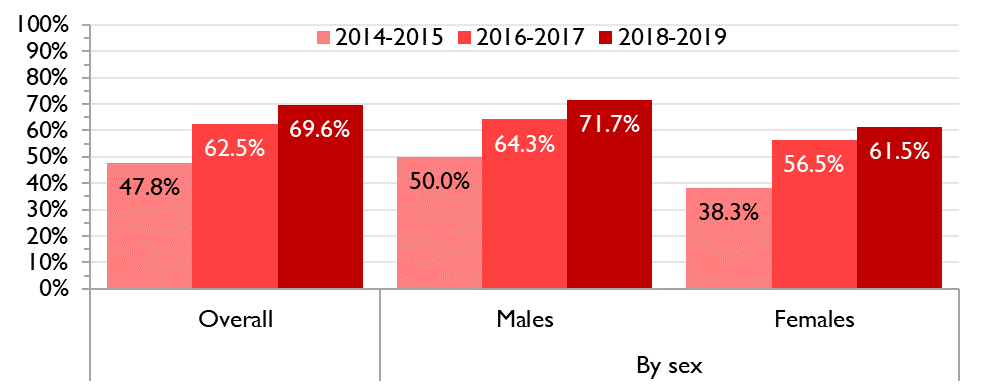
Although the time between diagnosis and viral suppression has improved for both males and females, a greater proportion of newly diagnosed males are virally suppressed within six months of diagnosis compared to females
Figure 5. Percent of people newly diagnosed with HIV in Ontario (nominally) who achieved viral suppression within six months of diagnosis, overall and by sex, 2014-2015 to 2018-2019
*VL = viral load
The proportion of all people newly diagnosed with HIV who were virally suppressed within six months of diagnosis increased from 47.8% in 2014-2015 to 69.6% in 2018-2019. Over the same time period, this proportion increased from 50.0% to 71.7% among males, and from 38.3% to 61.5% among females.
9.0% of males and 10.3% of females did not link to care at all in 2018-2019 (included in the denominator).
For more information, including additional breakdowns by sex, age, and health regions, see the full report here (link).
For a discussion of the impact of the pandemic on HIV tests and diagnoses in 2020, see our blog post, Impact of COVID-19 Pandemic on HIV testing and diagnosis in Ontario.
Stay tuned for more OHESI reports coming soon!
OHESI is a collaboration involving AIDS and Hepatitis C Programs of the Ontario Ministry of Health, Public Health Ontario, the Public Health Agency of Canada, and the Ontario HIV Treatment Network. The objectives of OHESI are to analyze, monitor and disseminate knowledge products on the epidemiology of HIV in Ontario.